4 Ways FLIR Thermal Studio Makes Drone Inspections More Efficient
FLIR Thermal Studio Suite™ enables pilots to efficiently manage thousands of thermal images and videos with advanced processing features needed for predictive maintenance on critical components, system troubleshooting, and increased productivity.
To successfully capture accurate drone inspection data, you need to fly in the right conditions and in the right relationship to your target. But that’s just one important element. It is just as important that your images are correctly processed and that your findings are reported accurately. FLIR Thermal Studio software is a powerful tool that lets you optimize your images, take accurate measurements, batch process images, and report your findings, all with a single program.
Image Optimization – Thermal Tuning and Color Palettes
Image optimization depends upon adjusting the image so that it displays the temperature differences you need to see. This does not relate to temperature measurement. Thermal Studio’s image optimization capabilities only affect how the image looks: they will not impact temperature measurement.
Manually adjusting the image’s Span and Level is a process called thermal tuning. A thermal imager can detect temperatures that are much hotter and colder than what you’re looking at, but provide no useful information outside of the temperatures that are actually in the scene. Span refers to the window of temperatures seen in an image, and Level refers to the mid-point of the Span. Span is analogous to the contrast levels on your television, while Level is the similar to brightness.
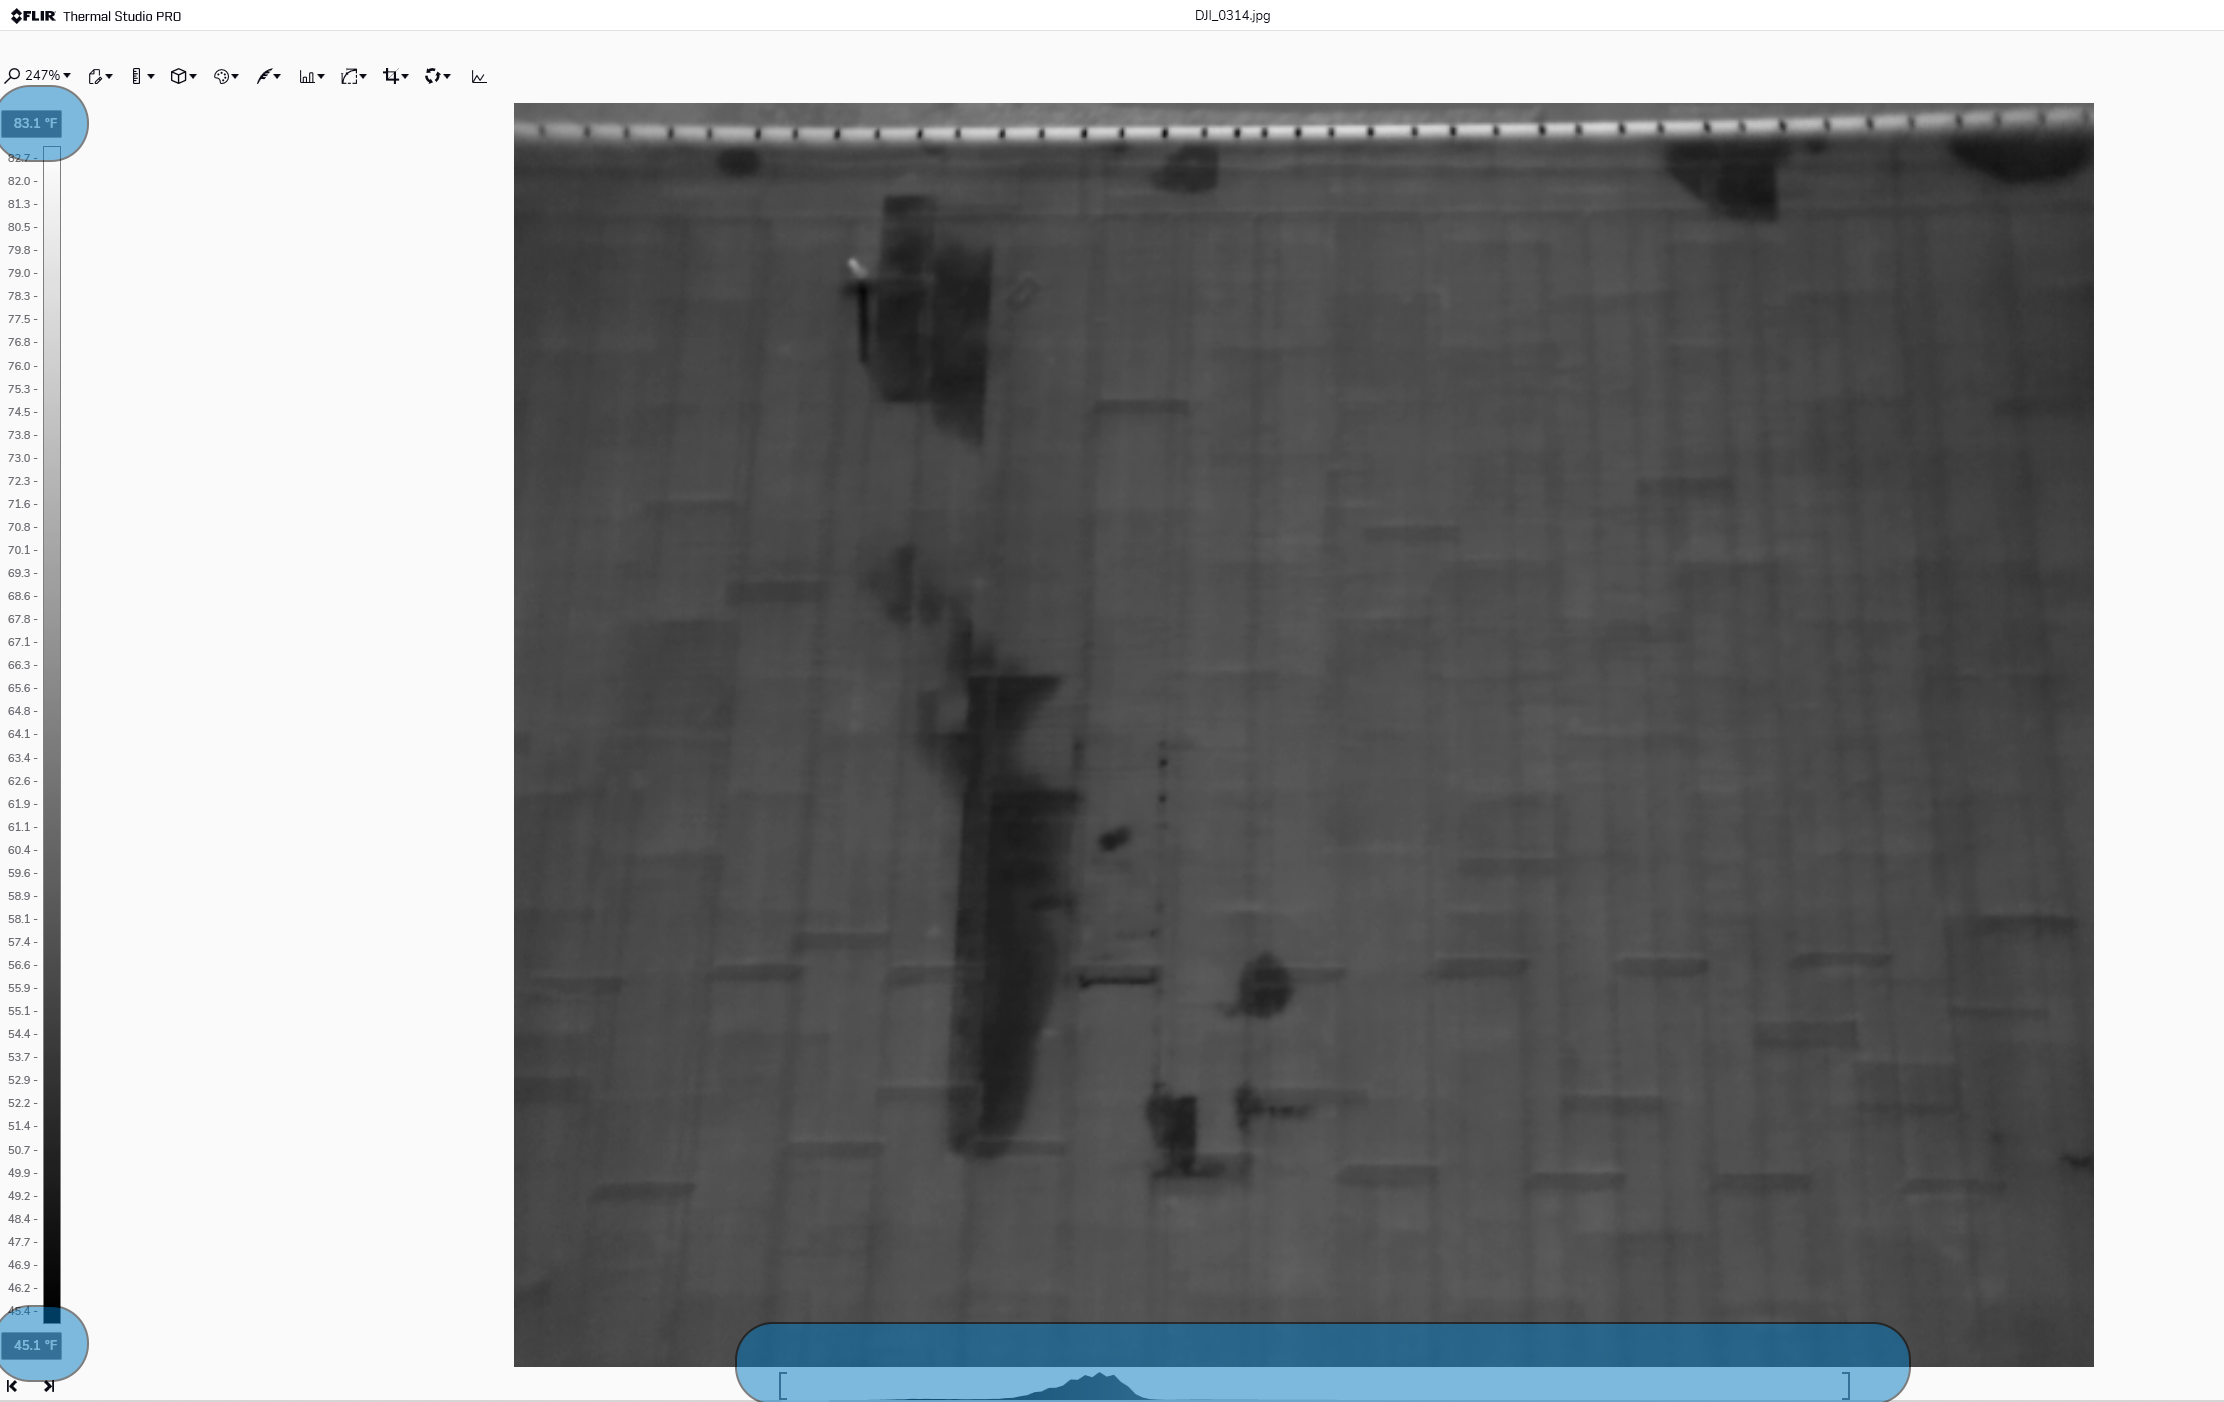
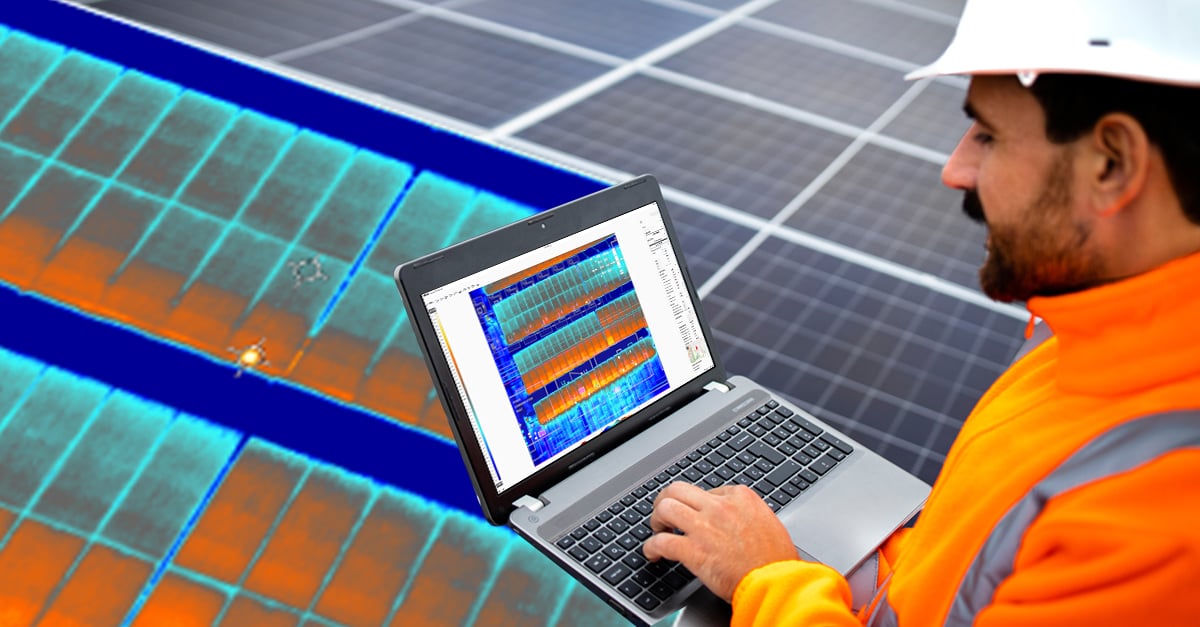
Figure 1. Adjust Span Using Numerical Scale or by Dragging the Brackets on the Horizontal Bar
In this image of a flat commercial roof, the Span is 45.1°F to 83.1°F: these metrics can be seen on the scale to the left of the image, along its vertical axis. Everything above 83.1°F is white, everything below 45.1°F is black, and everything in between is assigned a color or shade of grey. Those colors or shades provide the visual details you need, but sometimes the Auto Adjust feature doesn’t put those colors on the temperatures you need to see. The span of temperatures that have colors assigned to them can be adjusted by either typing numbers in the scale to the left of the image or by dragging the brackets on the horizontal bar below the image.
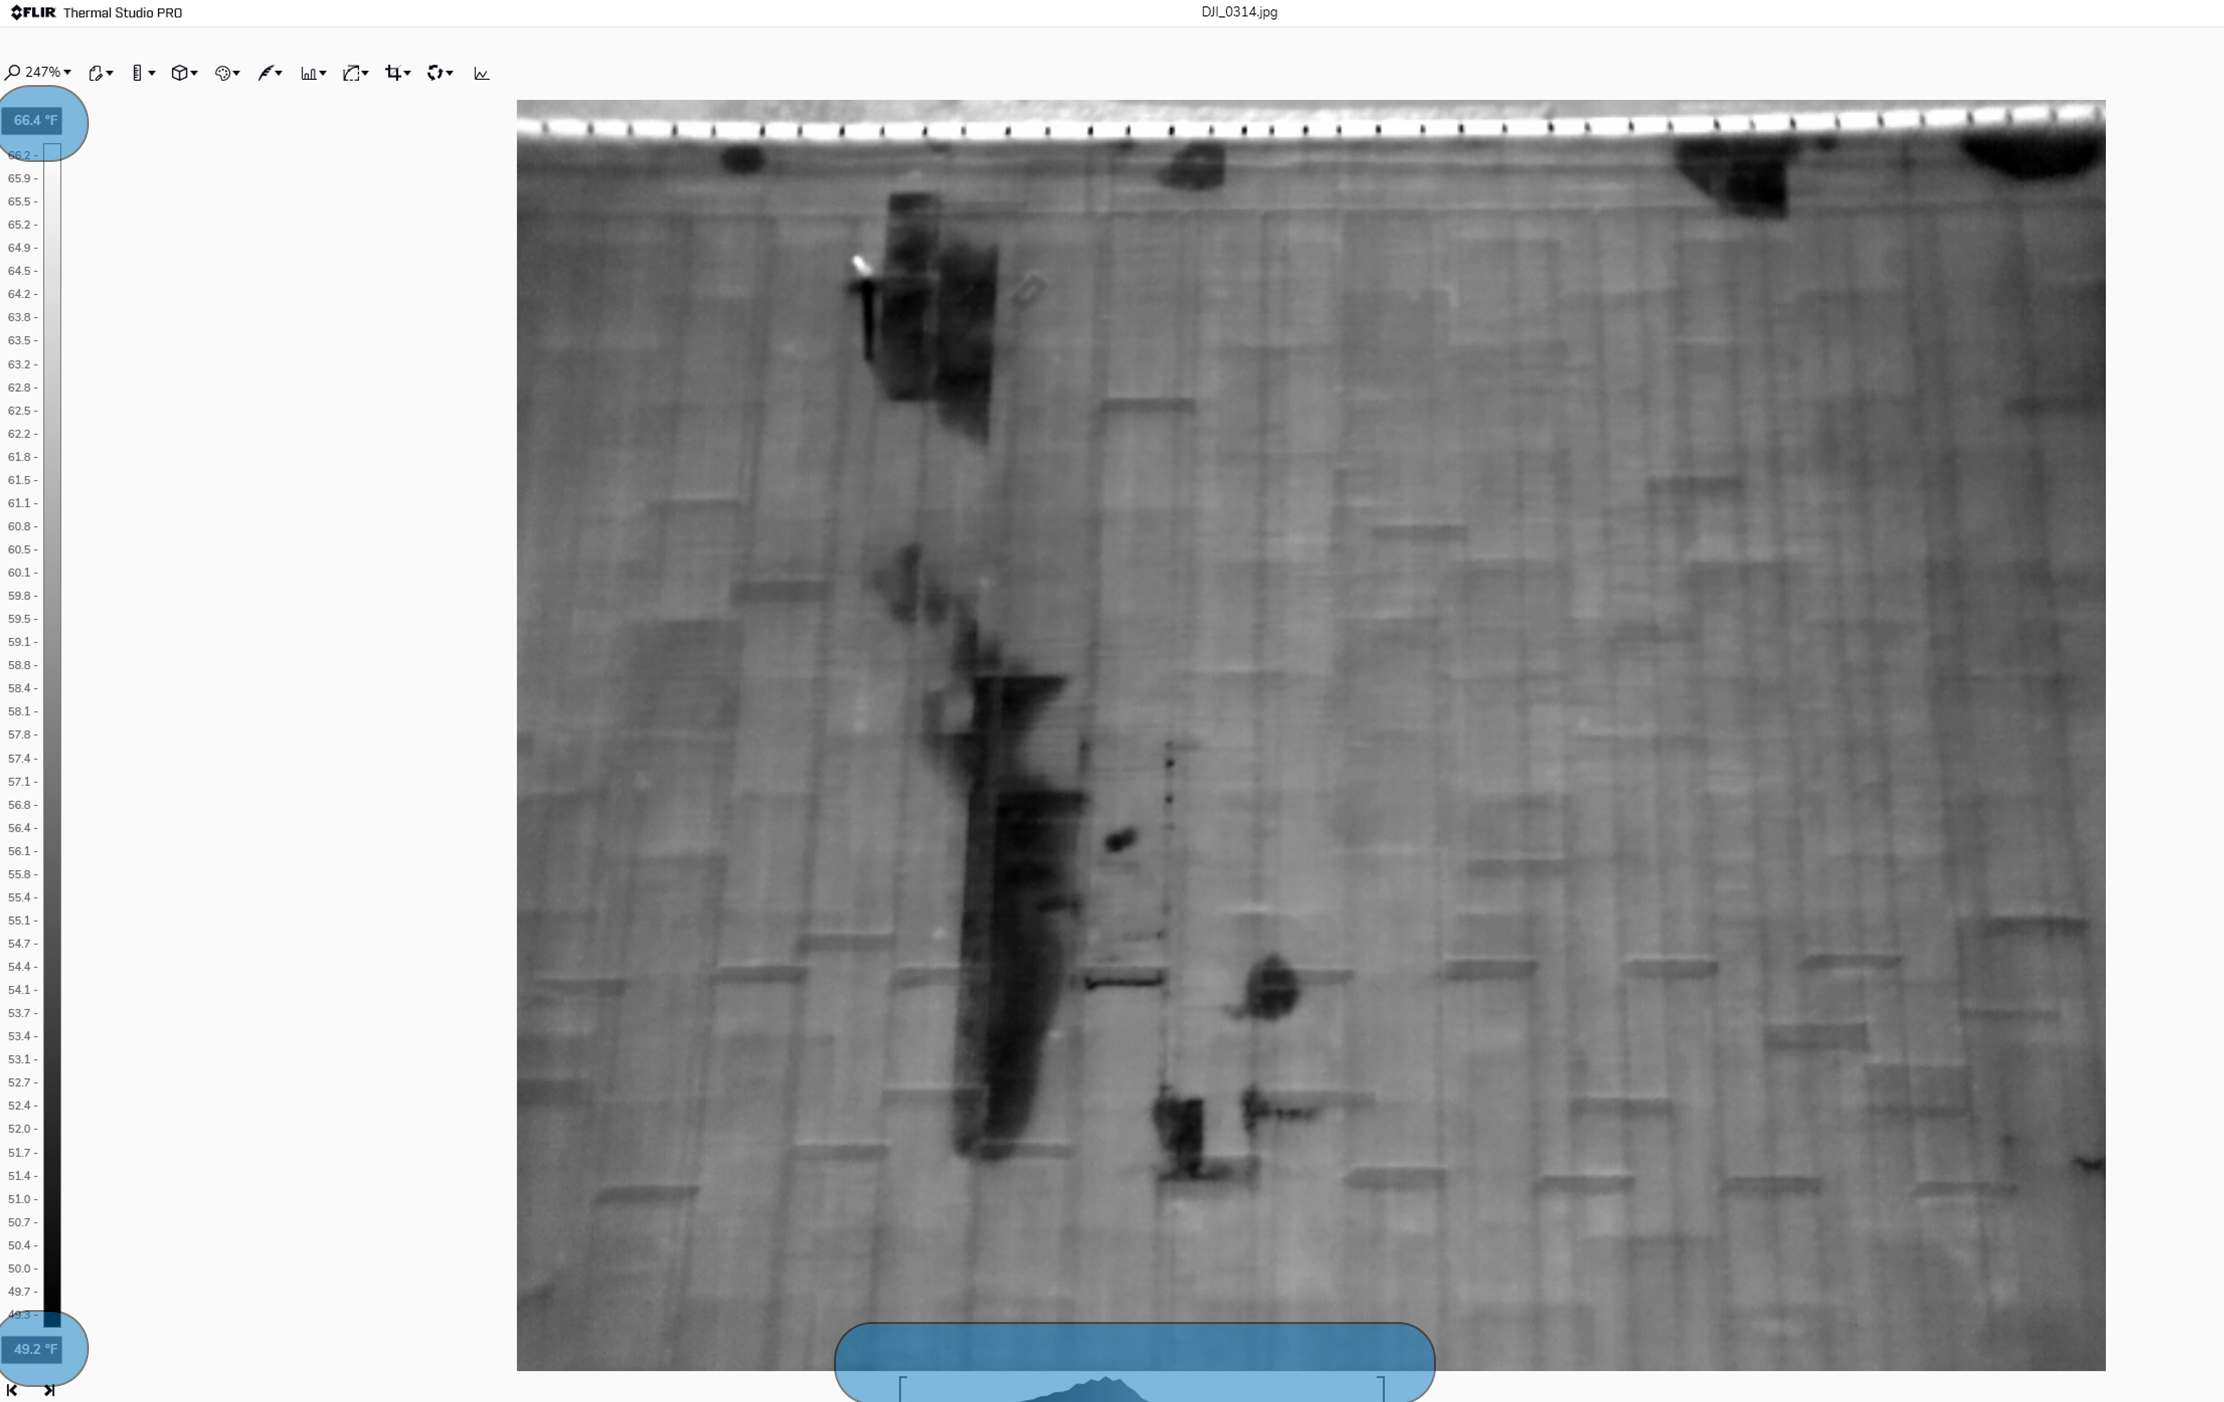
Figure 2. Roof with Adjusted Span of 49.2°F -66.4°F Enhances Thermal Anomalies
In the same image, the roof has some thermal anomalies. To see them better, you can thermally tune the image. For example, by adjusting the span to 49.2°F -66.4°F, the anomalies that could indicate moisture damage (and which did upon further investigation) can be clearly seen.
The image's color palette can also be adjusted in Thermal Studio. Because thermal imagers create pictures of invisible heat energy, colors are applied to different intensities of thermal energy to allow visualization of those thermal differences. Thermal Studio offers multiple color palettes to provide thermal images that can be understood easily.
Figure 3. Multiple Color Palettes are Available to Optimize Thermal Image Appearance
The most common color palettes are grey scale – White Hot and Black Hot. As the name suggests, in White Hot, the hottest thing in the image is white, the coldest thing is black, and everything between the two is displayed as a shade of grey. In the Black Hot palette, the reverse is true. Thermal Studio allows you to select from several standard color palettes to produce the most effective result.
The palette you consider best will depend on the thermal contrast within the image, how your eye responds to color differences, and personal preference. Note that some color palettes, like Rainbow HC, were designed to enhance temperature differences in scenes that contain minimal inherent temperature differences. This means that using a high contrast (HC) color palette for a scene with a high degree of contrast may make slight temperature differences harder to see.
Changing color palettes does nothing to the image’s underlying temperature data, so you can feel free to try different ones and pick the one you like.
Temperature Measurement
Converting the apparent temperatures you see in flight to corrected true temperatures is a complex process. Thermal Studio includes several tools to help you generate accurate measurements.
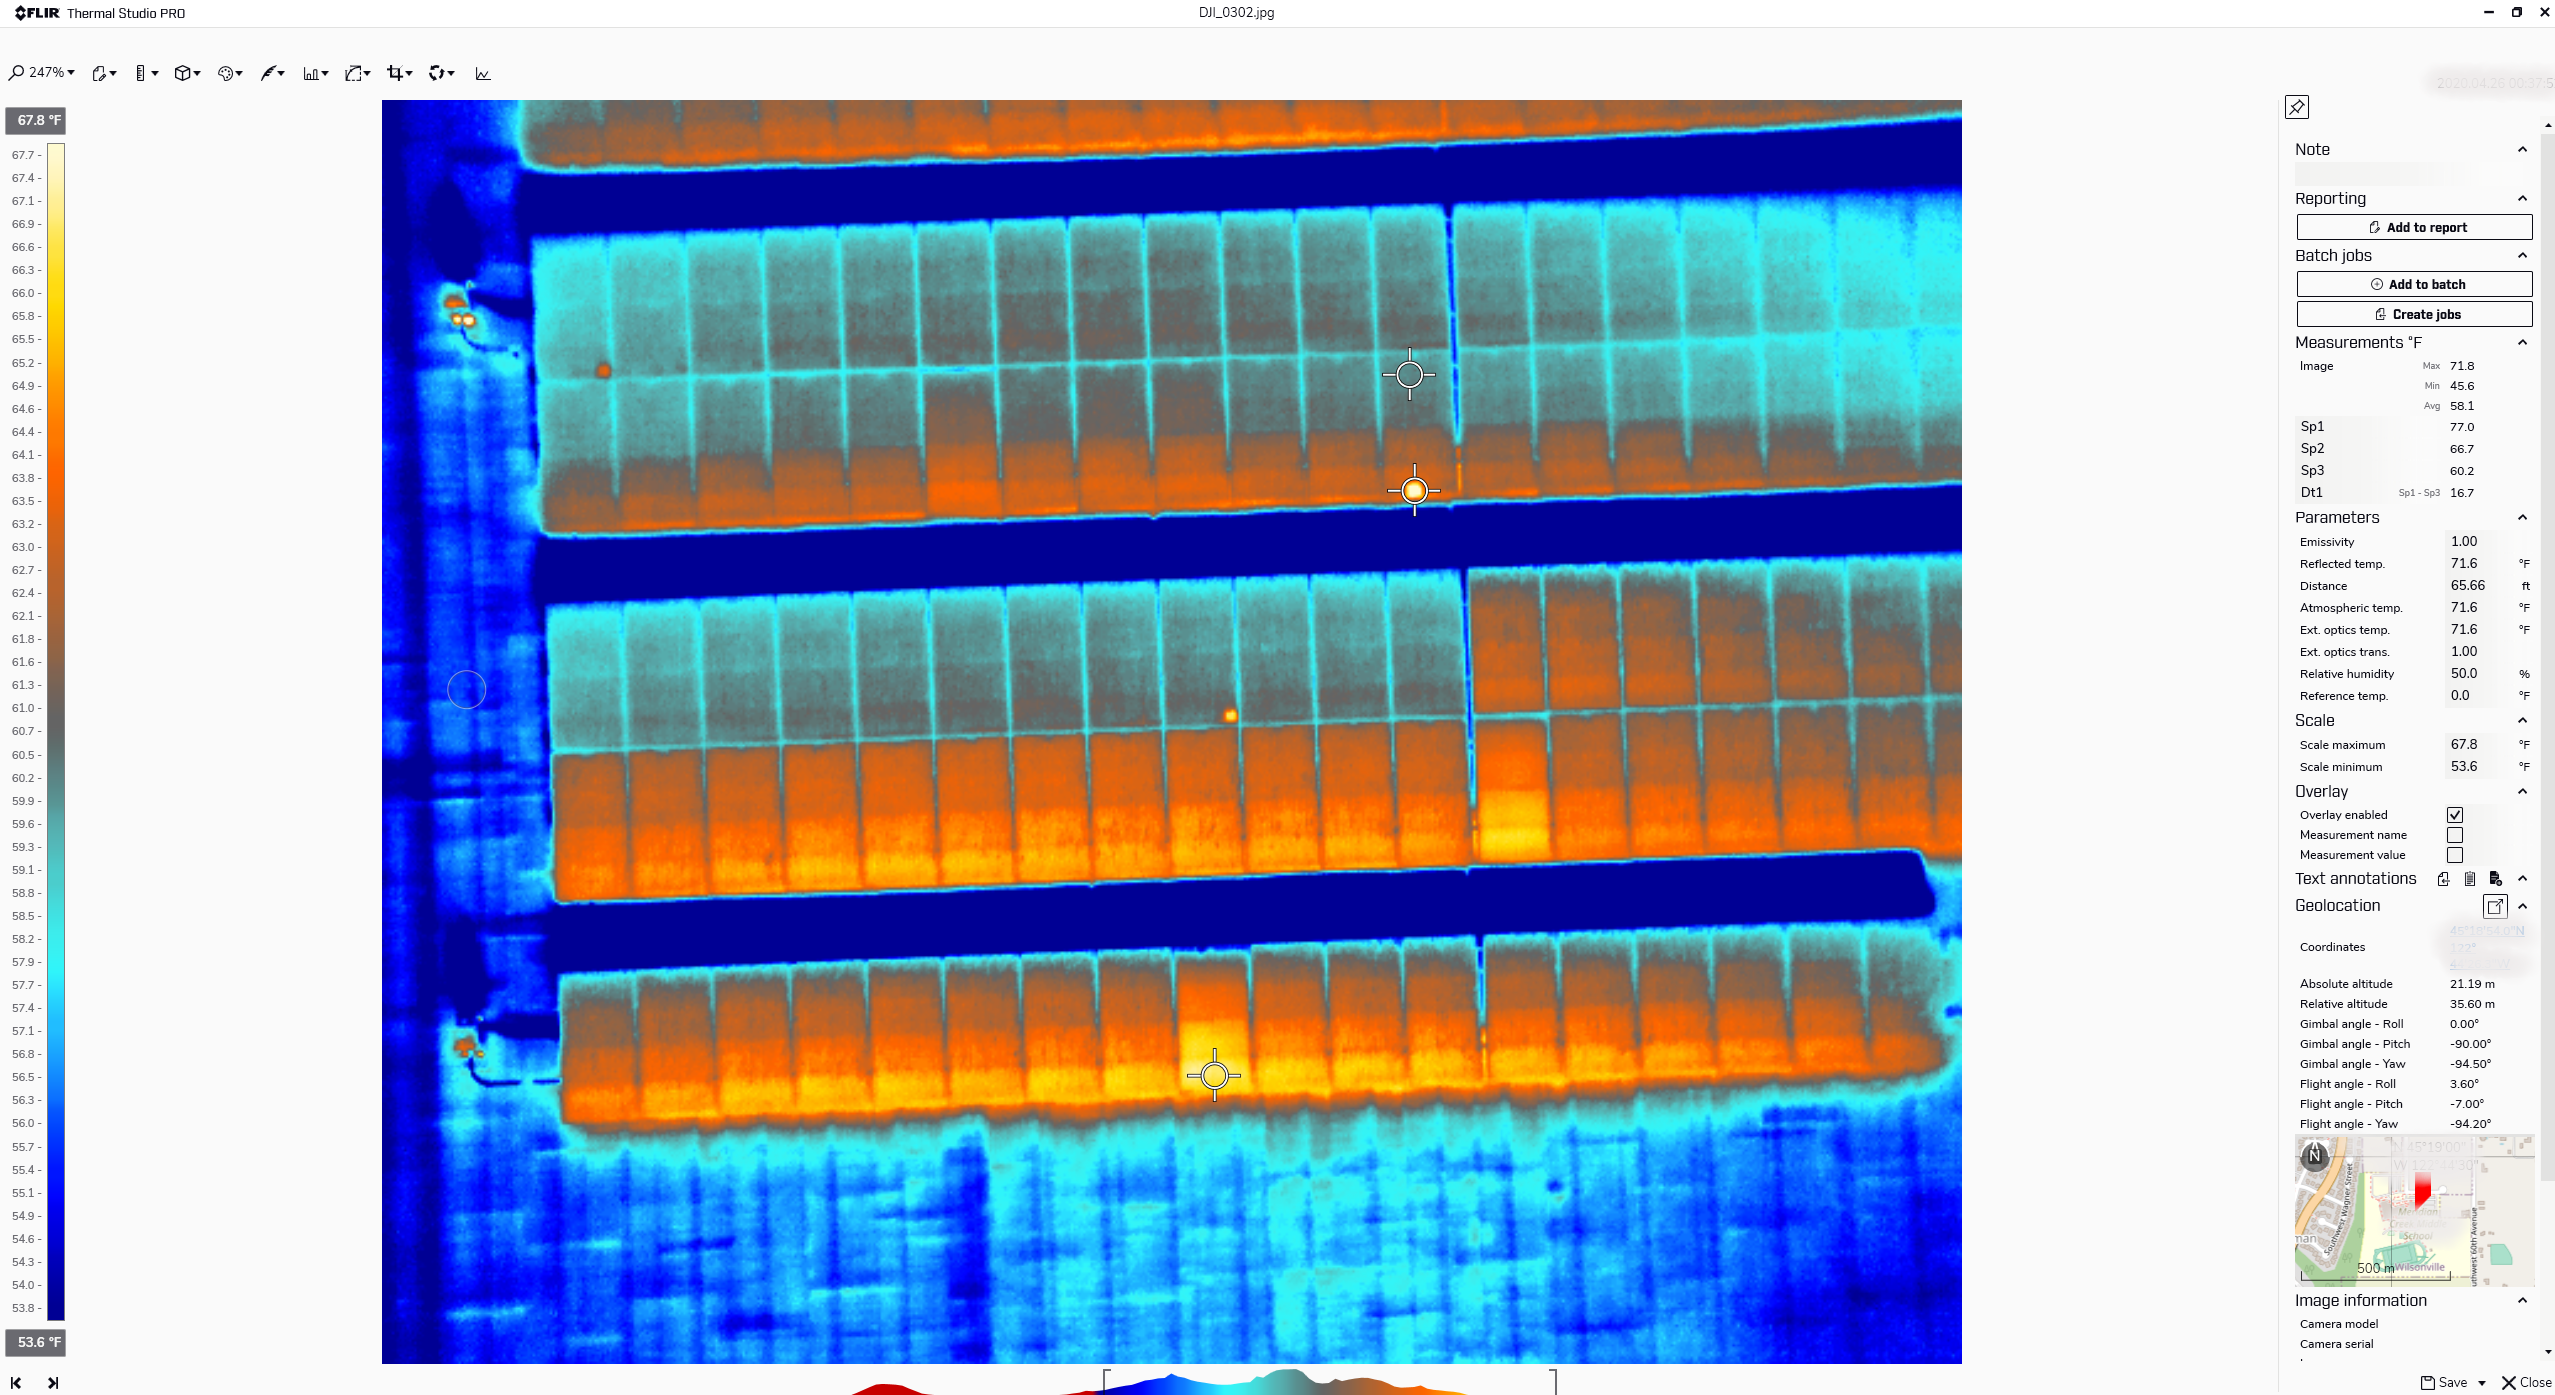
Figure 4. Use Thermal Studio to Adjust Parameters and Display Temperature Measurements
Measurement tools are displayed under the ruler icon. They fall into two categories: Spot and Area tools. The Spot tool measures a specific target. Select the Spot option and click on the item you want to measure to get the average temperature of the 4x4 pixel square inside that Spot circle. The measurement will be displayed in the right sidebar under the Measurements heading. You can position an unlimited number of Spot tools on an image. You can also use the Delta tool to automatically compare the temperature difference between spots.
Area tools work in the same fundamental way, but use different shapes. Area tools provide readings for the hottest and coldest pixels within a designated area and the average temperature of all the pixels within that area. Area tools can be rectangular, circular, ellipses, lines, or freeform polygons.
The Parameters section of the right sidebar displays all the adjustable variables that compensate for the differences in material, surface conditions, reflected temperatures, and atmospheric factors that impact the accuracy of your temperature readings. Remember that thermal cameras detect infrared radiation rather than temperature. They calculate temperatures based on the intensity of the radiation and the compensations you enter for emissivity, reflected temperature, ambient temperature, humidity, and distance to the target. If these parameters are not entered correctly, the temperature calculations will be incorrect.
Batch Processing
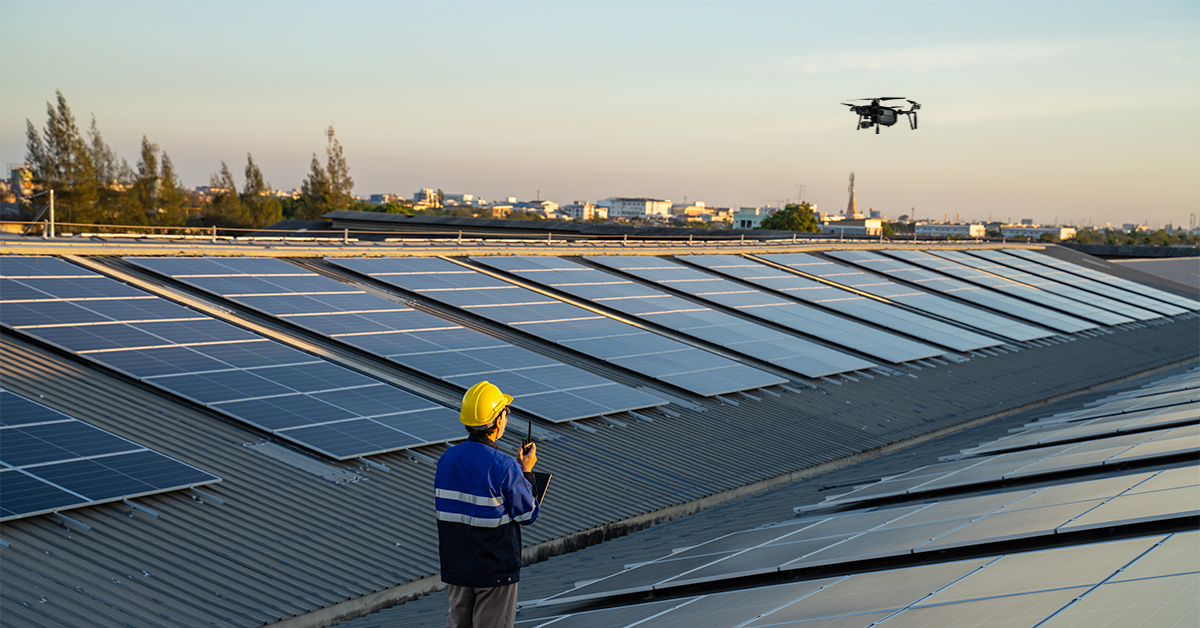
Using drones rather than handheld cameras for thermal inspections provides significant advantages, including the ability to inspect expansive areas quickly and to capture many images in the process. Roof and solar inspections usually require capturing large datasets of thousands of images to create orthomosaics and other collective data products.
Thermal Studio’s Batch Processing function is a tremendous time saver for drone pilots. Batch processing lets you select time images you want to process, then apply the same color palette, temperature scale, temperature measurement parameters, and more to the entire dataset in seconds. This can save hours otherwise spent preparing images for reports and entire datasets for stitching.
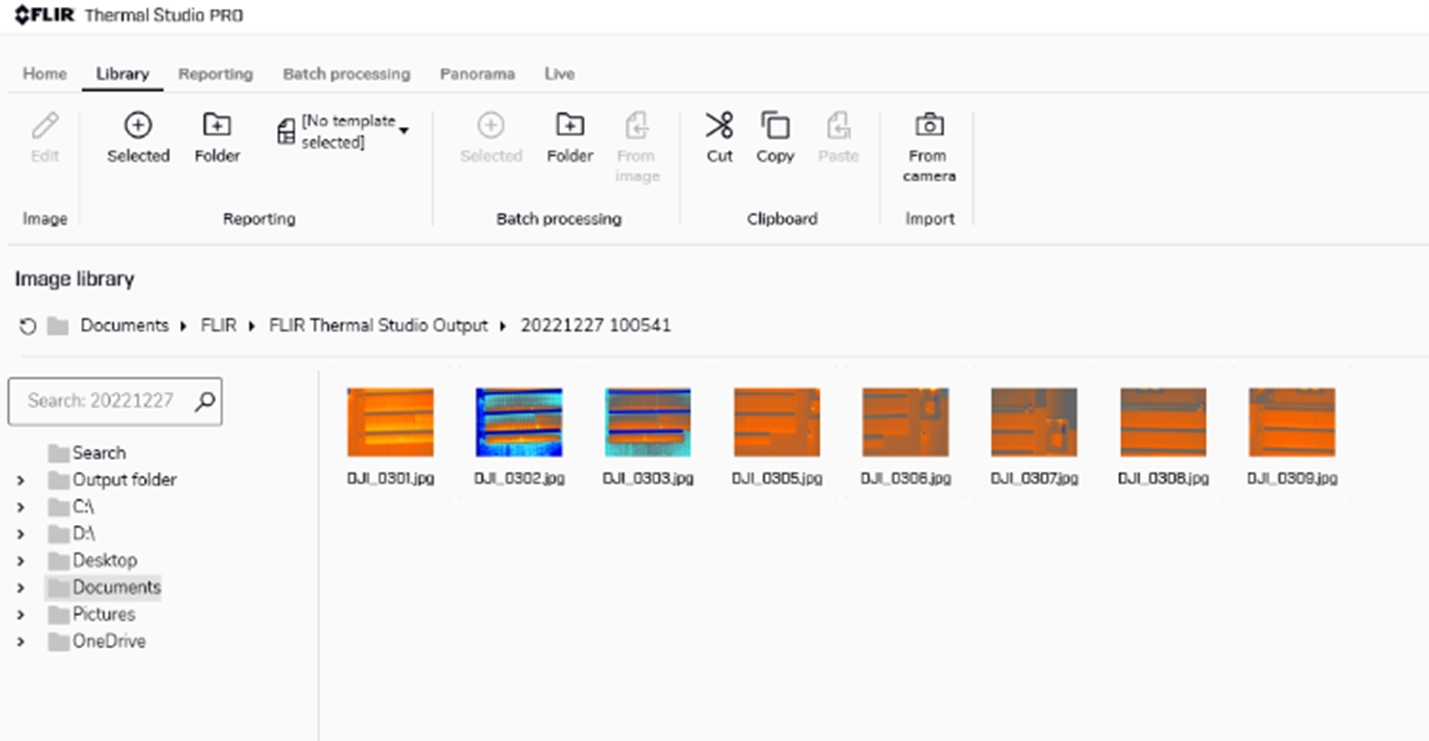
Figure 5. Batch Processing Applies Parameters and More to Multiple Images Simultaneously
Batch Processing is straightforward in Thermal Studio. From Library, select the images to be processed. In the Batch Processing section, choose Selected, then choose the options you want to apply to the batch of images. In this example, all of the selected images will be changed to a different color palette. Select the color palette and begin processing. The images will be changed to the new color palette in seconds. You can also set them all to the same Span and Level settings, or even add temperature measurement tools to all of the images at once.
Reporting
Flying the drone and gathering thermal data from inspections is only useful if that information can be communicated. Thermal Studio is a reporting powerhouse, and it is incredibly flexible and easy to use.
After thermally tuning your image, measuring your anomalies, and finalizing your analysis, Thermal Studio provides an option to add the image to a report and select the report template you want to use. You can also create your own. Thermal Studio automatically generates a report that contains all of your measurement data and provides notes fields for commentary and recommendations. The report can be sent to anyone with the Thermal Studio software. They can view your live thermal images or export the report as a PDF for anyone to see.
Conclusion
Using a professional drone with a thermal camera provides critical information for industrial inspection, including roof, utilities, solar, and more. Teledyne FLIR’s Thermal Studio is the single piece of software that drone operators need. It provides essential functions for optimizing thermal images, batch processing, and reporting findings to employers and clients. Please visit FLIR Thermal Studio for more information. 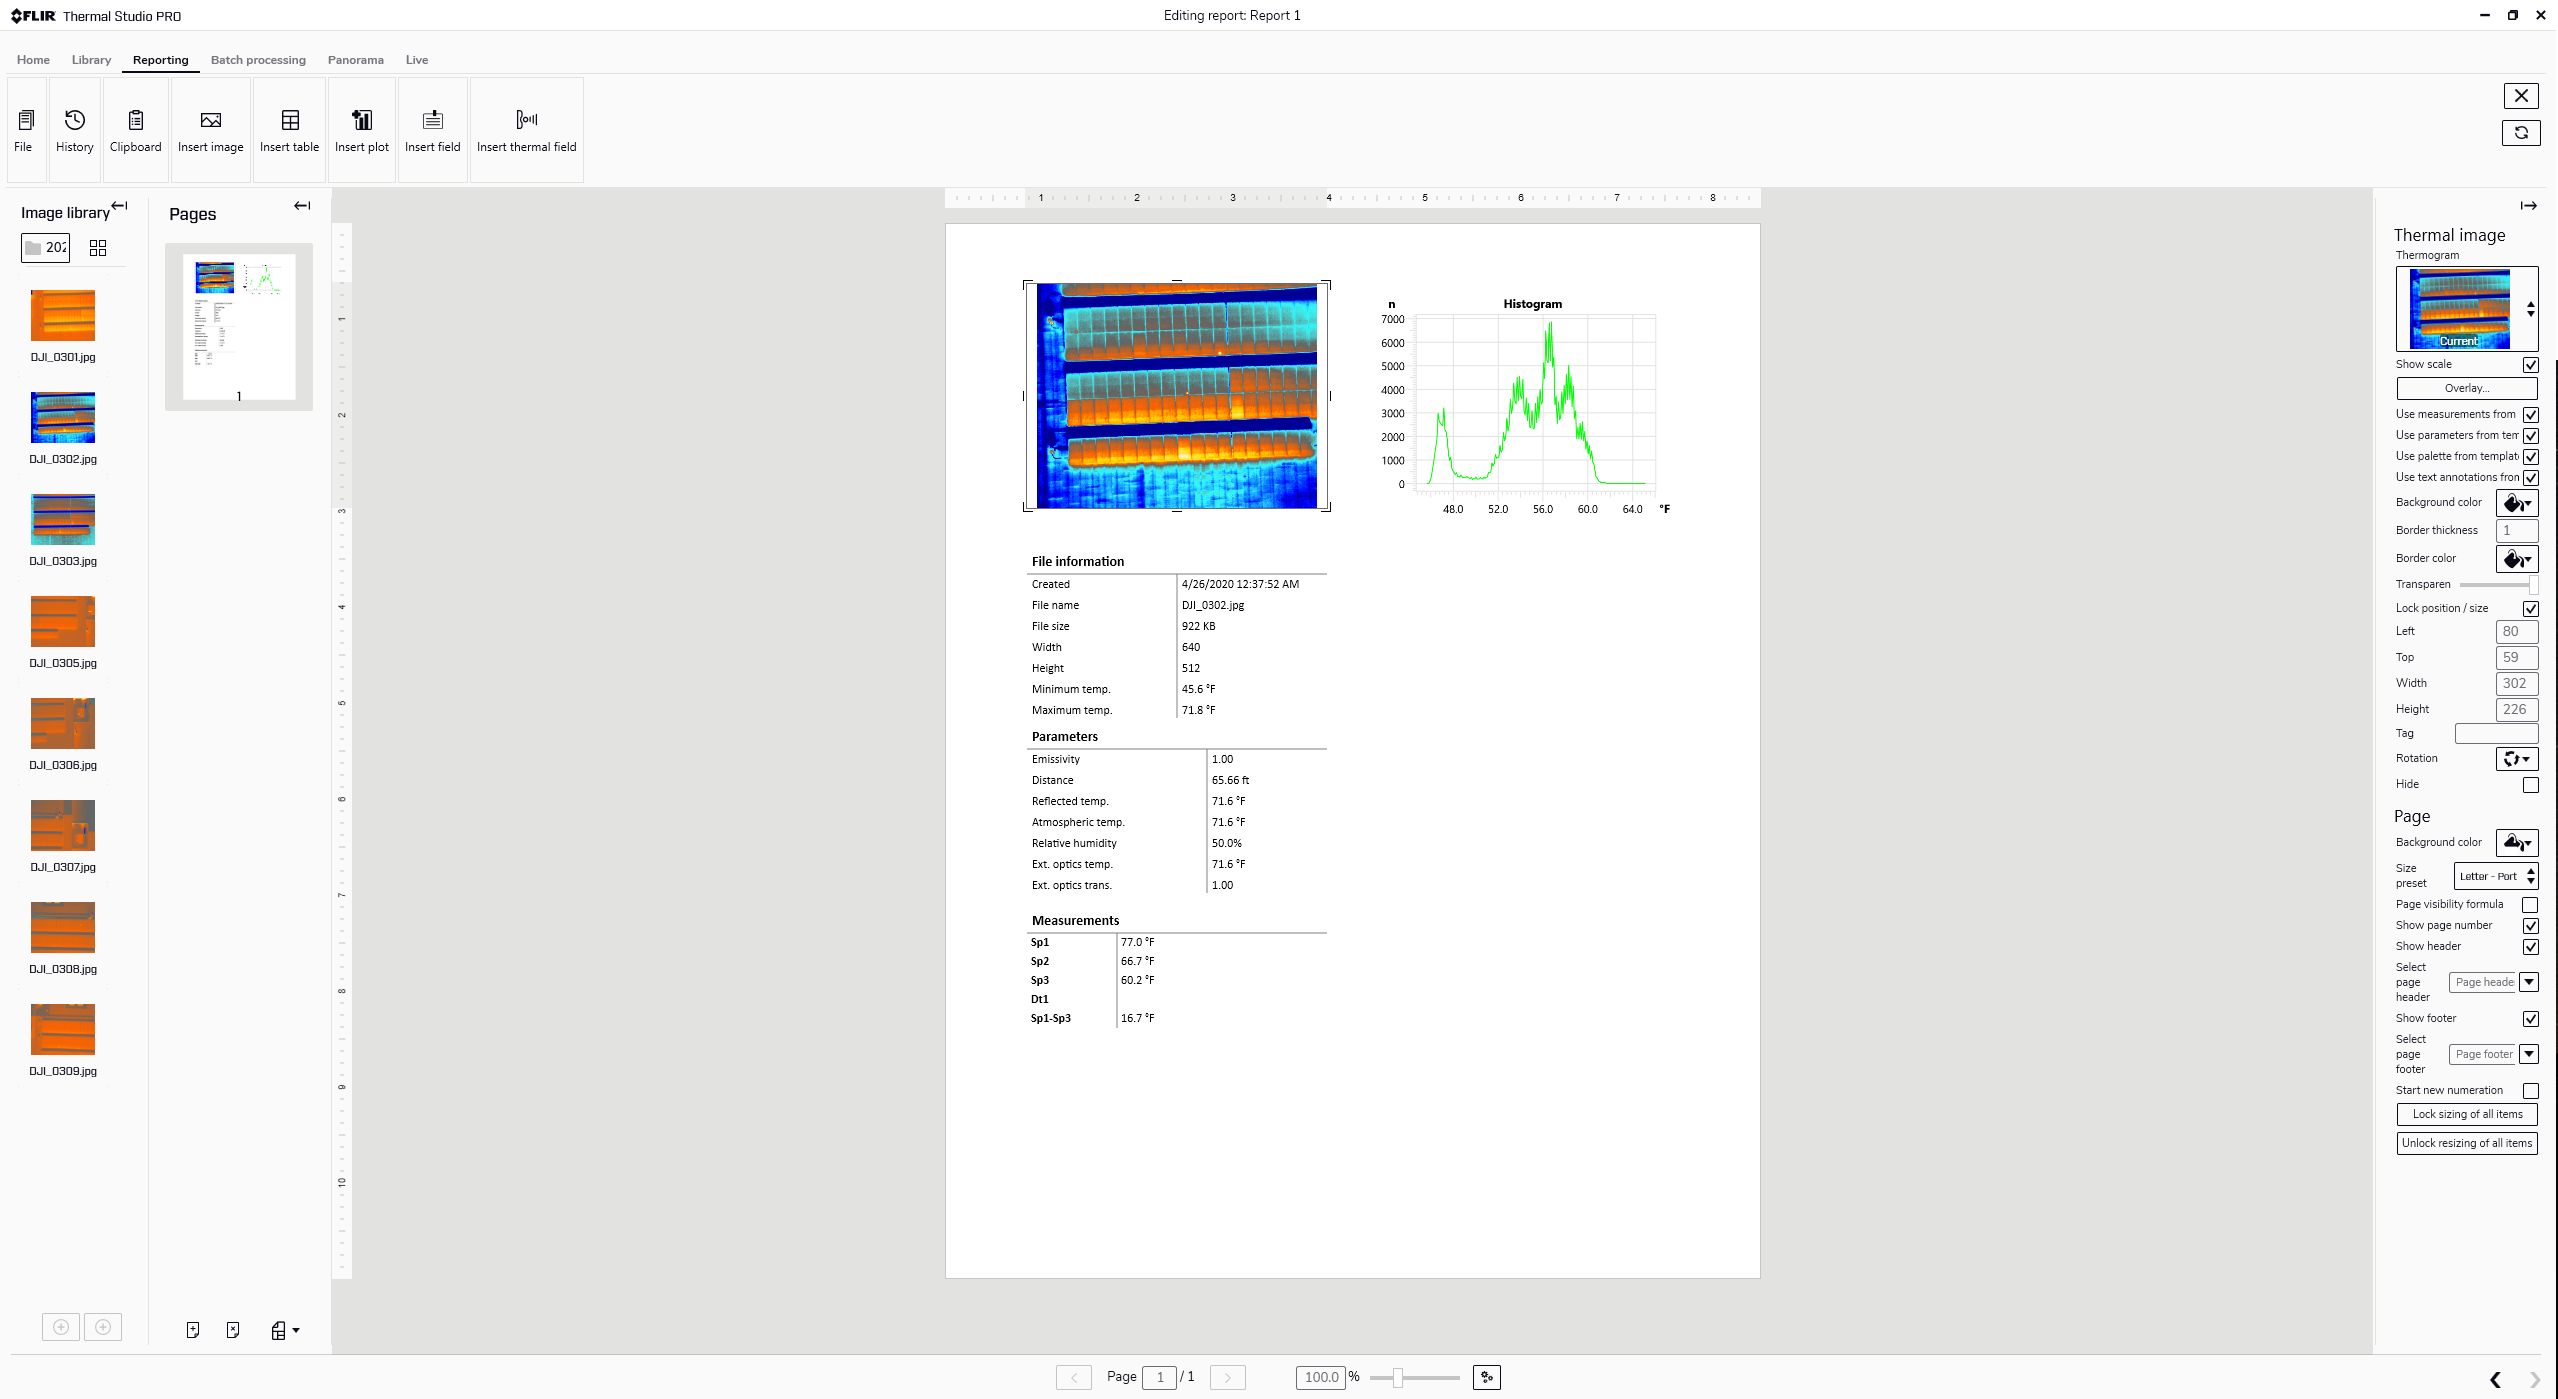
Figure 6. Share PDF Reports to Efficiently Drive Maintenance
Related Articles
-
 Fundamentals
FAQ - Everything You Need to Know About SIRAS
Learn more -
 Fundamentals
Frequently Asked Questions: Thermal Imaging for Unmanned Aerial Systems
Learn more -
 Tech Note
UAS Radiometric Temperature Measurements
Read the Story