Modbus TCP Slave Exercise
Objective: The goal of this exercise is to learn how the camera works as a Modbus TCP slave device and how to connect it to a Modbus TCP master software.
Requirements: This exercise requires a FLIR camera supporting Modbus TCP, a computer with administrator rights, the software WideQuick Designer running on the computer and network equipment providing the infrastructure for the computer and camera to communicate with each other.
Introduction
Modbus TCP is a communication protocol used in industries all over the world. It is vendor neutral and makes it a convenient choice for system integrator to enable communication between sensors and a PLC (Programmable Logic Controller) in an industrial environment. The protocol can be used for controlling equipment and sending sensor data between different devices. Two important concepts in Modbus TCP is slave and master. In this exercise, the camera will be the slave and the computer will be the master. One can think of the slave as the server and the computer as a client connecting to the camera to get data for further processing.
Instructions
- Connect your computer to a network which also hosts a FLIR camera, the camera can be connected directly to the computer or via a switch/router.
If you do not already have WideQuick Designer installed, download it from here. Unzip it and during the installation, chose only the Designer as the rest of the components require a license.
Start the camera web interface by opening a web browser and navigating to the camera IP address. If you are unsure about the IP address, use the software FLIR IP Config to find the camera. Add a spot anywhere on the image. Then go to the Administration tab and press Firewall, select Modbus and make sure it is activated, then press Apply. Go to the Services tab and set Ethernet/IP to ON and press Apply, then close the web interface.
Start the software WideQuick Designer and press File -> New Project -> and give it a convenient name, then press Ok and Ok on the following pop-up.
Right click on Data Store and press Add Modbus TCP/IP Connection…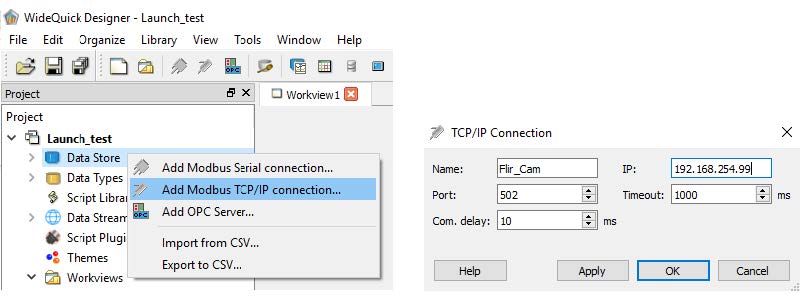
Give the connection a fitting name and enter the IP address of the FLIR camera. Then press Apply and OK.
Right click on the newly created connection and press Add Device… Configure it according to the image below. Press Apply and OK. Notice the number of x’s in the Address format field, it should be six x’s.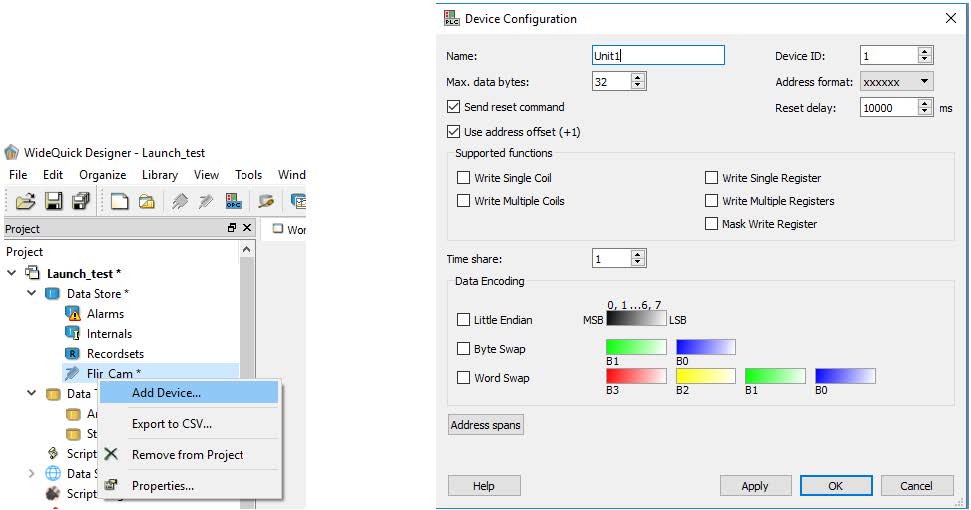
Now you are going to add the registers. Each analysis function has one register. To map the analysis function to the corresponding register, go to support.flir.com and search for the Modbus mapping document (hint: it is also as an appendix in the FLIR AX8 camera manual). In this exercise, it is enough to use the spot 1 register, which has the register value 402019. Double click on your device (called Unit1 in this case) and then press Add. Configure it according to image below.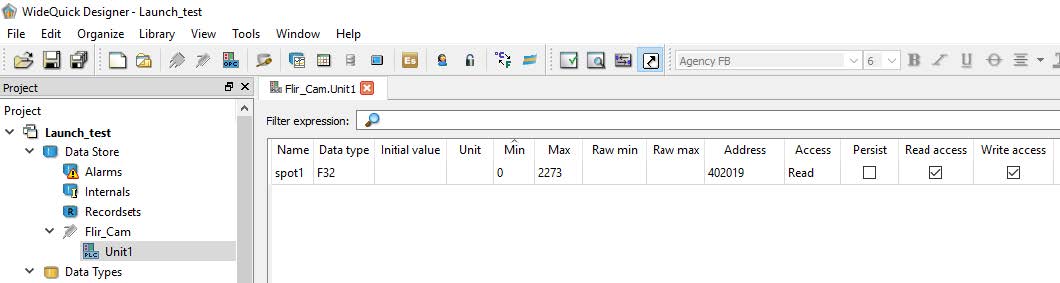
Now it is time to add some graphical components which can display the temperature value. To do this, double click on Workview1 under the Workviews menu to the left. Then select the Text symbol in the upper right pane and press anywhere in the workview to add this Text object. 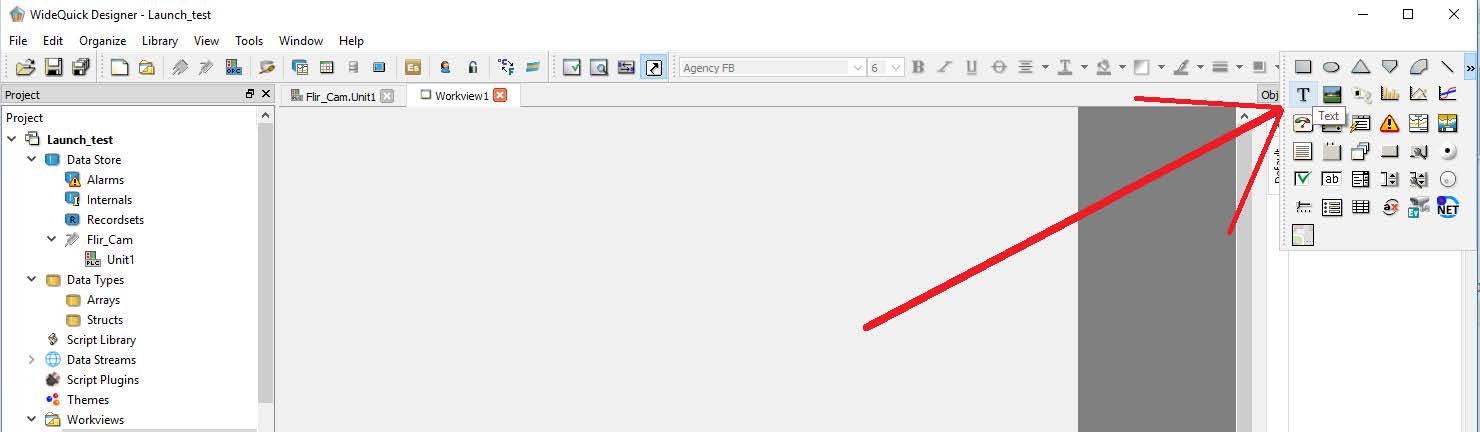
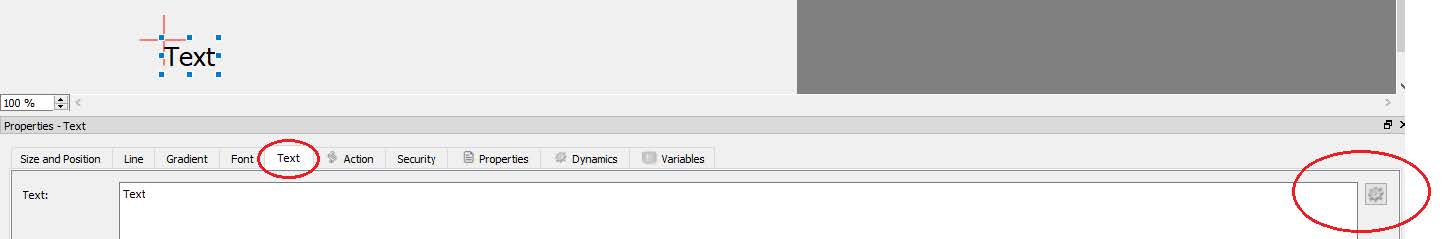
Once the Text object has been added, you can increase the font size and change color under the Font tab. Increase the font size to 26 then press the Text tab and press the cogwheel, according to the images below.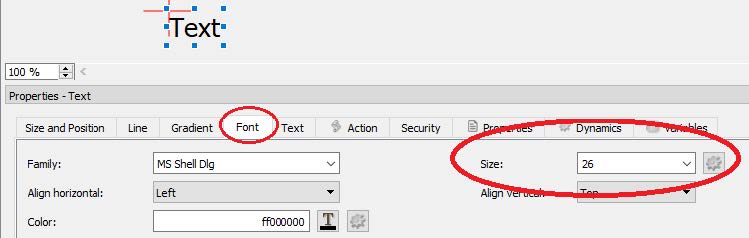
When you’ve pressed the cogwheel, change the type to Expression and select the spot value from the right menu, according to the image below. Then close that window and press File->Save…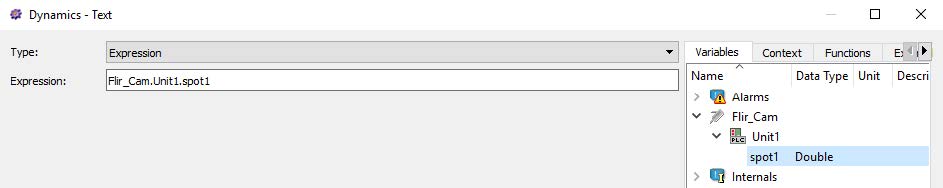
To run the software, press F5. This will start the preview which will be running for 5 minutes and then close itself. To run the software in a real live environment, you need to buy the ThermoVision Condition Monitor computer which includes all the licenses needed.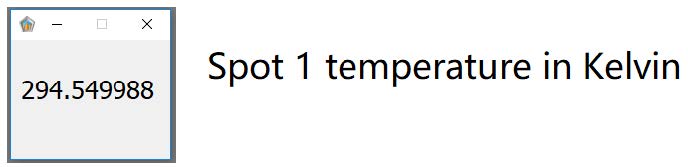
Add some more analysis values, for example box 1 maximum temperature. Also try to change the graphical user interface with other objects and colors. The image below shows a simple user interface with a histogram2 object connect to a data logger.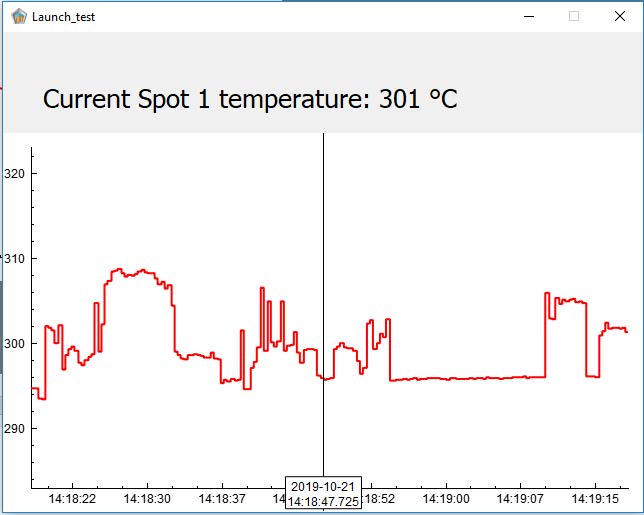
Related Articles
-
 Application Note
Set Up a Local Mail Server and Receive Email When an Alarm is Triggered
Read the Story -
Application Note
Modifying the graphical user interface on the TV CM
Read the Story -
Application Note
Restful API Exercise
Read the Story